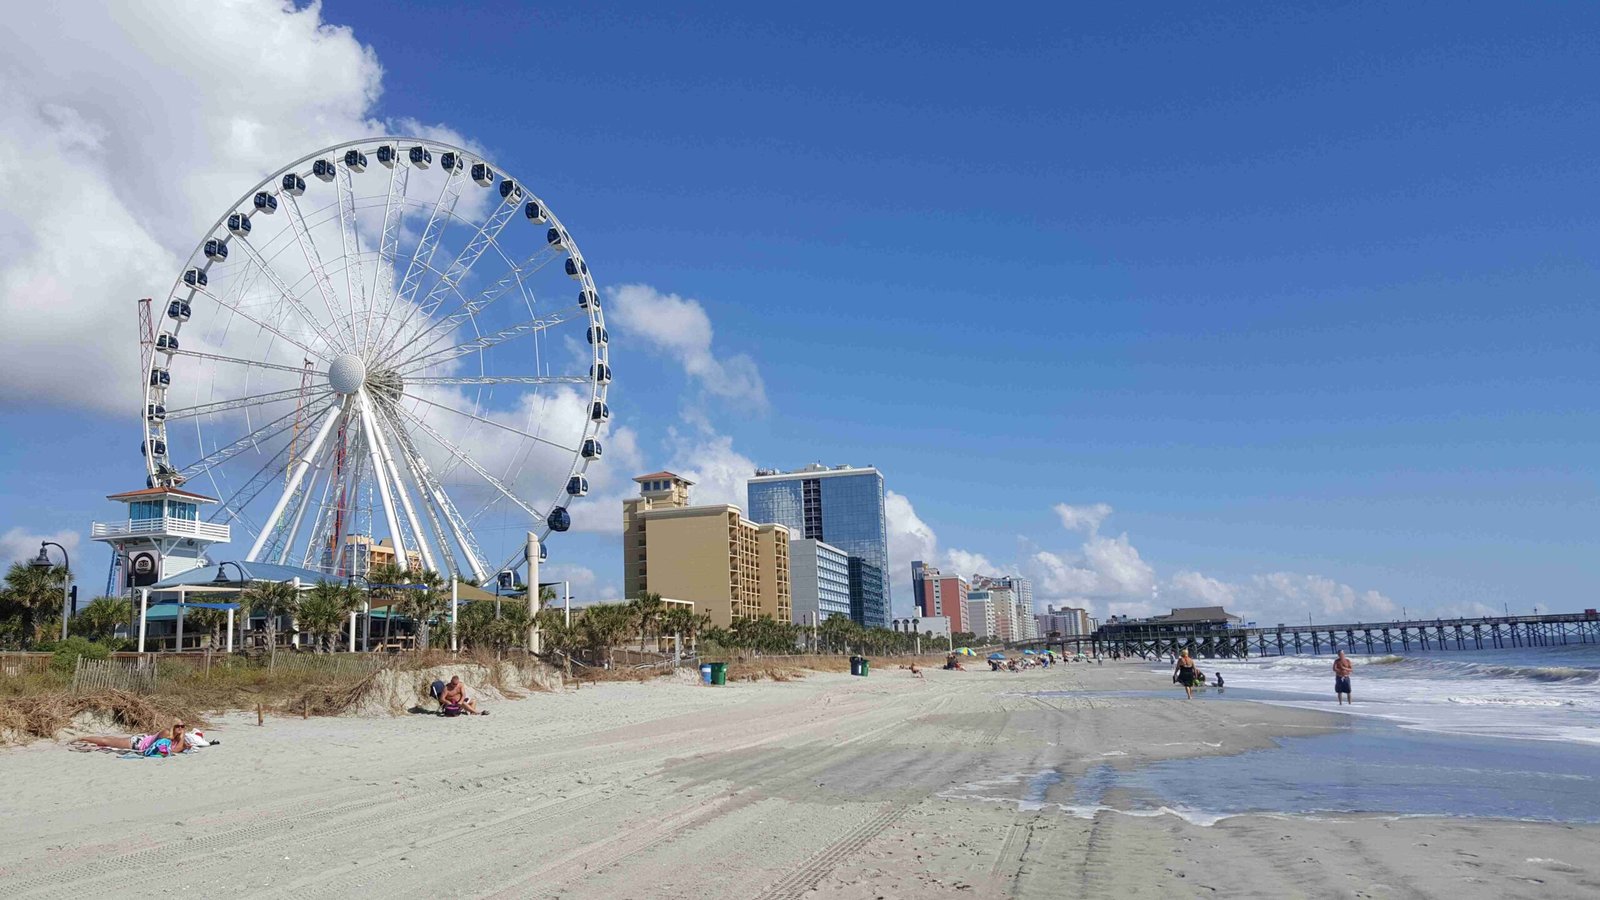
Myrtle Beach tourism statistics reveal a dynamic landscape of visitor engagement, with approximately 17.6 million tourists generating $12.5 billion in economic impact during 2023. The destination demonstrates resilience through fluctuating travel trends, maintaining strong visitor volumes while adapting to changing consumer behaviors and economic conditions.
How Many Visitors Does Myrtle Beach Attract Annually?

Myrtle Beach consistently draws substantial visitor numbers, with recent data highlighting impressive tourism performance:
- Total Annual Visitors: 17.6 million (2023)
- Direct Visitor Spending: $12.5 billion
- Year-over-Year Growth: 4.7% increase in visitor expenditure
Visitor Volume Breakdown
| Visitor Category | Percentage |
|---|---|
| Domestic Travelers | 92% |
| International Travelers | 8% |
| Repeat Visitors | 65% |
| First-Time Visitors | 35% |
What Drives Myrtle Beach Tourism?

Several key factors contribute to Myrtle Beach’s tourism appeal:
- Diverse Attractions
- 60 miles of pristine coastline
- Over 100 golf courses
-
Numerous family-friendly entertainment venues
-
Seasonal Flexibility
- Year-round destination
- Summer peak season
-
Attractive off-season travel opportunities
-
Economic Accessibility
- Competitive pricing
- Wide range of accommodation options
- Budget-friendly dining and entertainment
What Are the Economic Impacts of Tourism?
The economic significance of Myrtle Beach tourism extends beyond direct visitor spending:
- Job Creation: Approximately 35,000 tourism-related jobs
- Tax Revenue: Generates substantial local and state tax income
- Business Ecosystem: Supports numerous hospitality and service industries
Revenue Streams
| Revenue Source | Annual Contribution |
|---|---|
| Accommodations | $4.2 billion |
| Dining | $3.8 billion |
| Attractions | $2.5 billion |
| Retail | $2 billion |
How Do Visitor Demographics Influence Tourism?
Visitor composition plays a crucial role in Myrtle Beach’s tourism strategy:
- Primary Age Groups:
- 35-54 years: 42%
- 25-34 years: 28%
- 55+ years: 20%
-
Under 25: 10%
-
Travel Motivations:
- Beach relaxation
- Family vacations
- Golf tourism
- Entertainment experiences
What Challenges Does Myrtle Beach Tourism Face?
Despite strong performance, the destination encounters several challenges:
- Seasonal fluctuations
- Increasing competition from other coastal destinations
- Climate change impacts
- Infrastructure maintenance
Future Outlook for Myrtle Beach Tourism
Projections indicate continued growth and strategic development:
- Anticipated 3-5% annual visitor increase
- Enhanced digital marketing strategies
- Investment in sustainable tourism infrastructure
- Expansion of off-season attractions
Strategic Focus Areas
- Diversifying visitor experiences
- Improving technological integration
- Sustainable tourism development
- Enhancing visitor engagement
Conclusion
Myrtle Beach tourism statistics demonstrate a robust and evolving destination with significant economic impact. Continuous adaptation and strategic planning position the area for sustained growth and visitor satisfaction.
References:
- Myrtle Beach Area Convention & Visitors Bureau
- South Carolina Department of Parks, Recreation & Tourism
- D.K. Shifflet Visitor Volume Study
Disclaimer: Statistics are based on 2023-2024 data and subject to periodic updates.

